Climate Resilience
urban heat plume

A 3D numerical modelling to investigate the thermal plumes merging and buoyancy-driven airflow in urban areas
In this study, the performances of five different turbulence models, i.e., three URANS (Unsteady Reynolds-averaged Navier–Stokes equations) models and two LES (Large-Eddy Simulation) models are evaluated by comparing the velocity field with previous water tank measurements. Validation results show that all four turbulence models can capture the bending of thermal plumes toward the centre, and LES models provide a better prediction on the vertical velocity profiles, while both URANS models show underestimation.
The plume merging mechanism is analysed with the high accuracy LES results. Both pressure difference induced mean horizontal flow and shear instability induced turbulence are the main causes of plume merging. The coherent structure of plume merging is analysed by a quadrant analysis, which shows ejection and sweep events dominate the turbulence momentum exchange.
A case study with complex urban geometry is conducted to show the impact of thermal plumes merging in the real high density urban areas. The convergence airflow at the pedestrian level is estimated to 2 m/s, which is comparable to wind-driven ventilation and beneficial to thermal comfort and air quality.
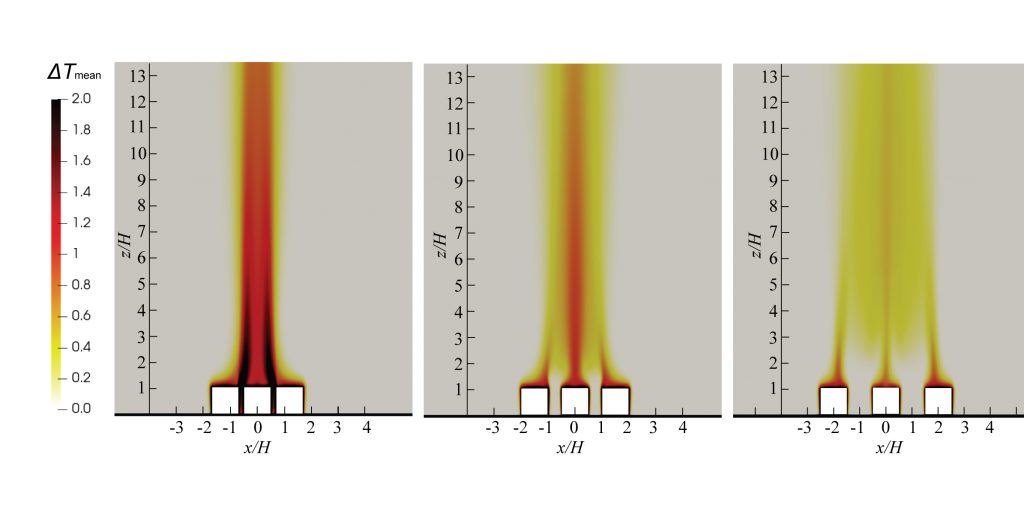
Figure. Mean temperature increment at the plane with , from the Smagrinsky LES model simulation.
Outputs:
- 3D thermal plume merging for urban areas is modelled using CFD;
- Performance of four turbulence models is evaluated by comparing with PIV measurement;
- Both wind velocity and air temperature are measured in CFD simulation;
- Both pressure difference induced mean horizontal flow and shear instability induced turbulence are the main causes of plume merging;
- The buoyancy-driven airflow at a real high-density urban area is crucial in a no wind condition.
Publications:
- Mei, S. J., & Yuan, C. (2021). Three-dimensional simulation of building thermal plumes merging in calm conditions: Turbulence model evaluation and turbulence structure analysis. Building and Environment 203, 108097.
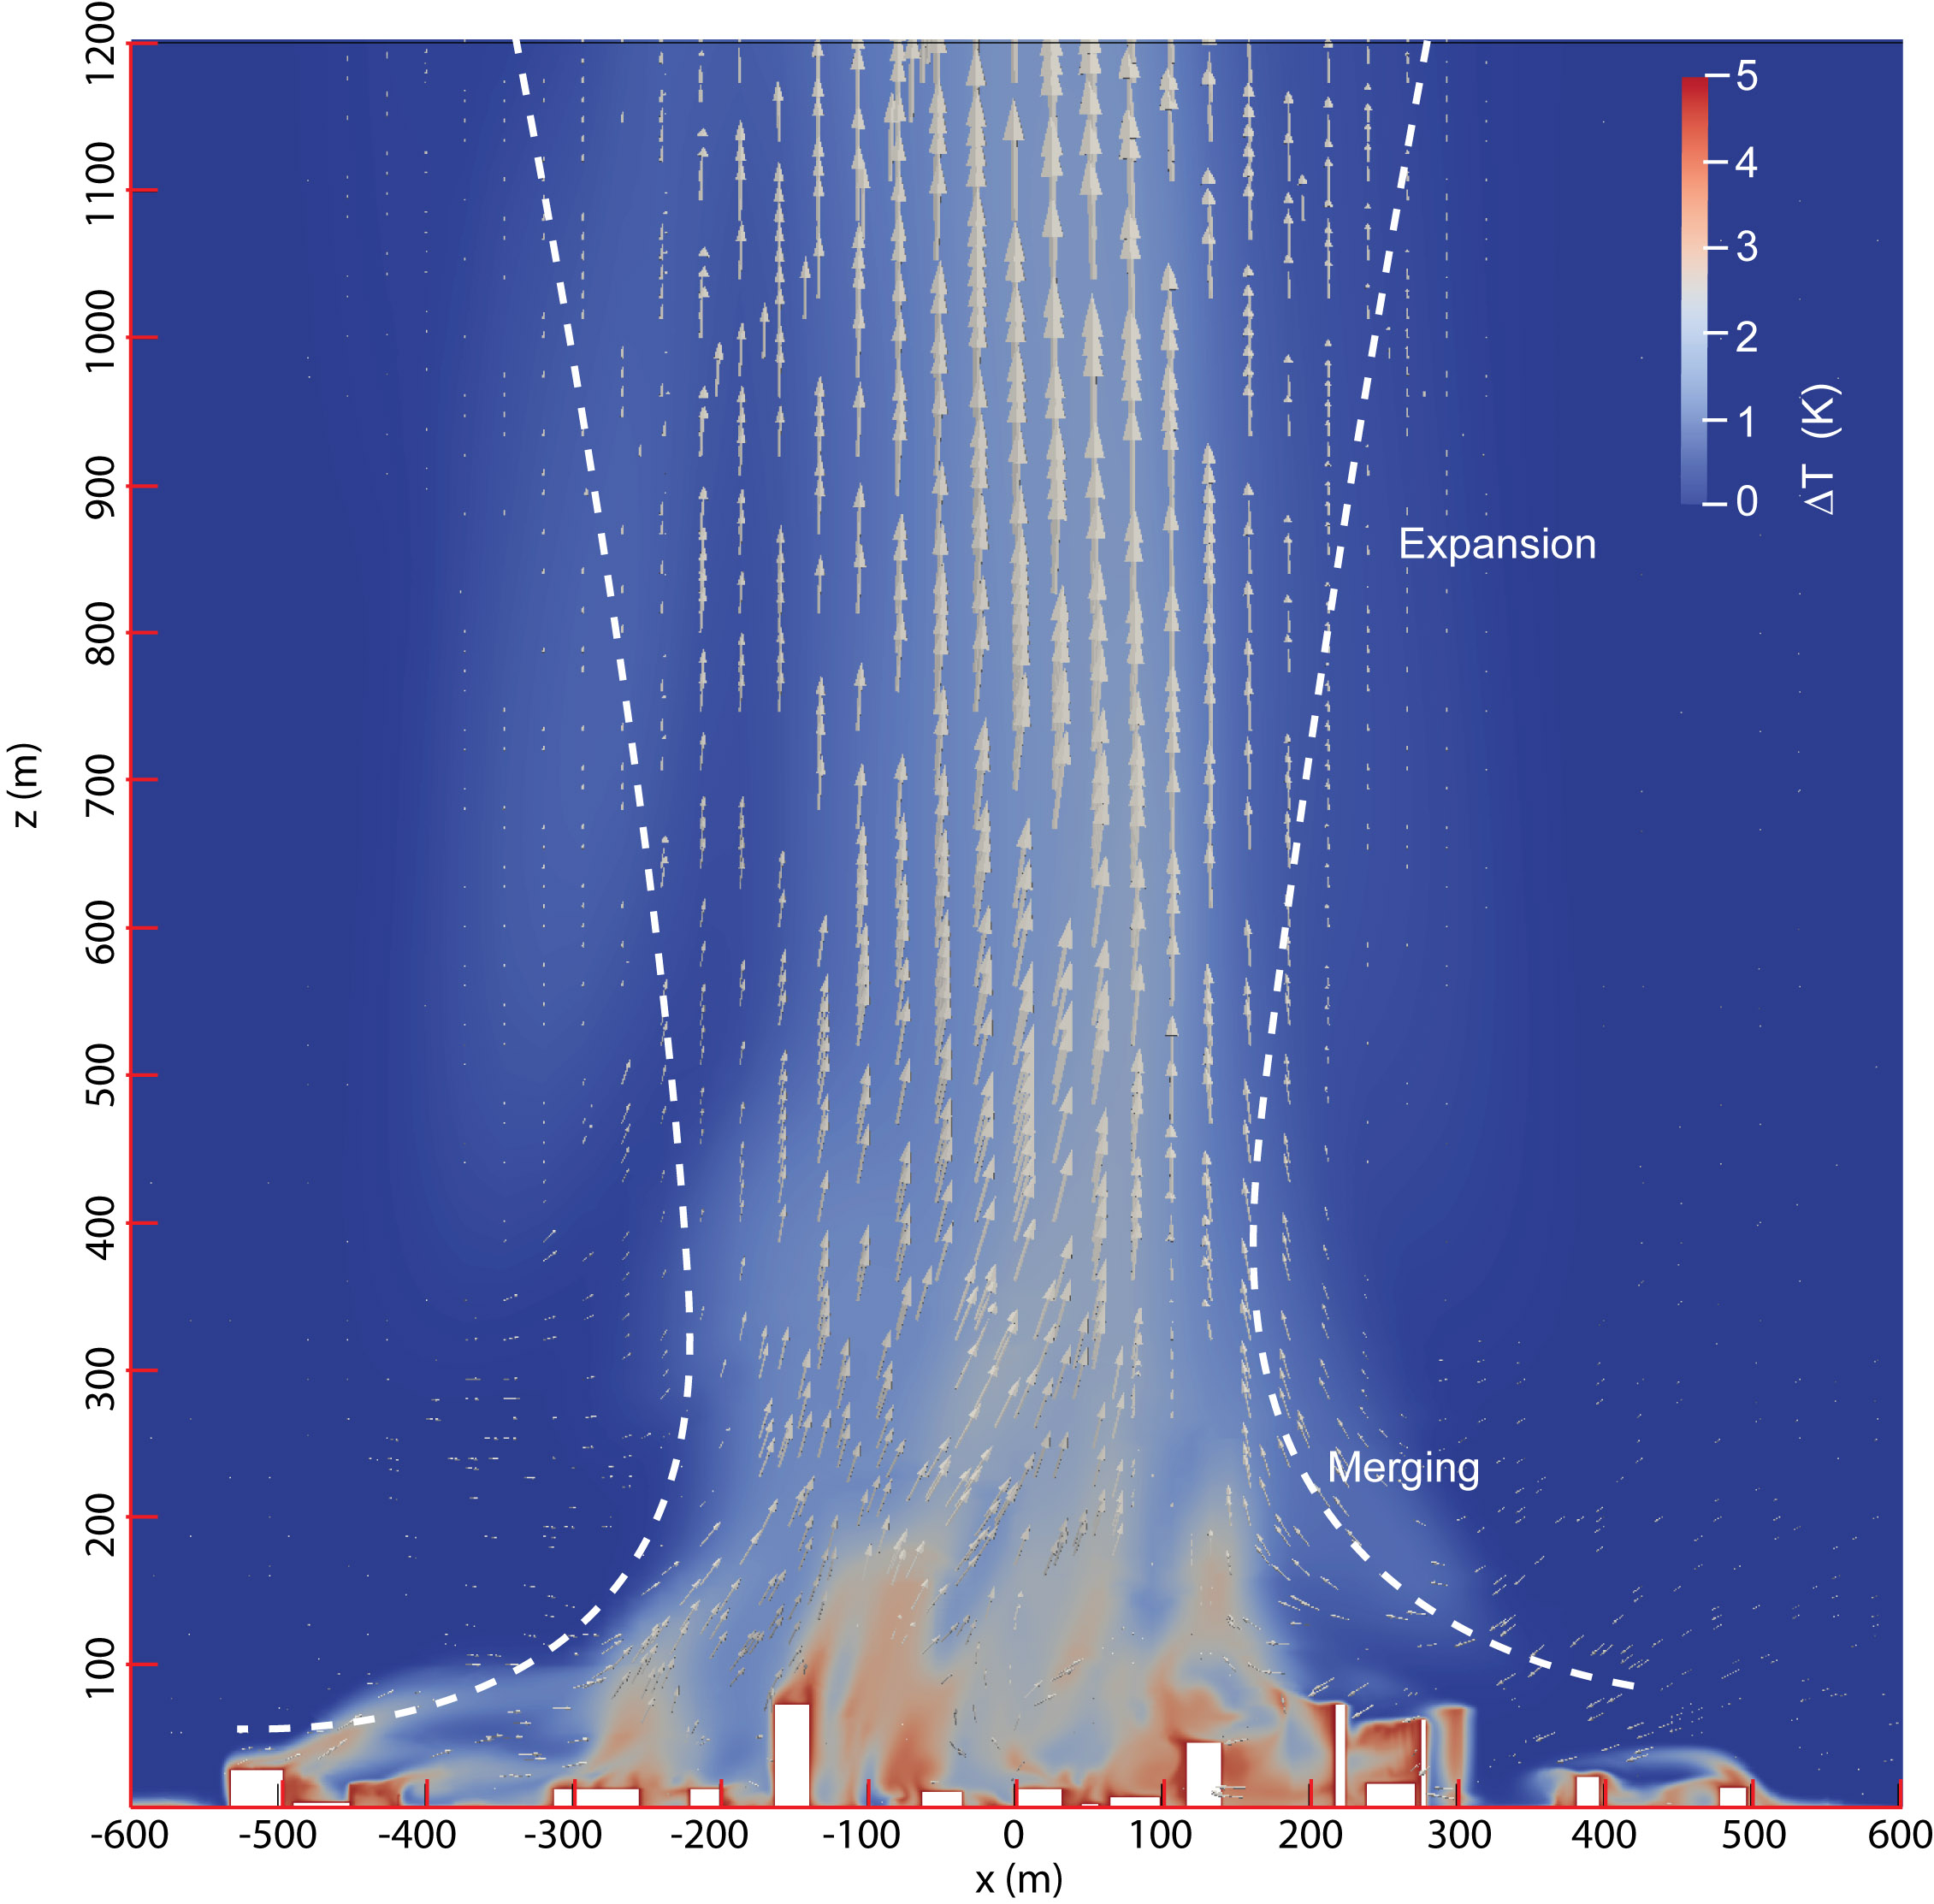
Figure. Time-averaged air temperature increment distributions a vertical plane (at y = 0).