To Develop Landscape Guidelines for Application of Green Plot Ratio in Singapore
Principal Investigator: Associate Professor Dr David Ho Kim Hin
Under the MND Research Fund for the Built Environment, awarded by the Building and Construction Authority (BCA) on 8 April 2008 to the National Parks Board (NParks), the research project WBSR-294-000-022-490 (about S$1 million in kind and actual funding), and entitled “To Develop Landscape Guidelines for the Application of Green Plot Ratio (GnPR) in Singapore” was formed on 9 July 2009 between NParks (under Dy Director Dr TAN Puay Yok; now A/P with NUS DOA); NUS; JTC Corp; HDB and URA. Fieldwork support was provided by Broadway Malyan Ltd under its partner, Adj Prof (Nottingham University) Jason POMEROY. GnPR is developed by the Dr ONG Boon Lay (formerly SL, NUS DOA; now with University of Melbourne) to guide the provision of greenery in urban settings. GnPR uniquely allows a three-dimensional quantification of greenery on a site through the use the Leaf Area Index (LAI) measure. Specific research objectives:
- To provide GnPR optimal levels for various land-use types and to benchmark them against current levels of greenery provision for various types of land uses;
- To identify the impact of various levels of greenery provision on capital and maintenance costs;
- To develop recommendations and landscape guidelines for implementing optimal levels of GnPR within an urban design framework to facilitate a sustainable landscape for Singapore.
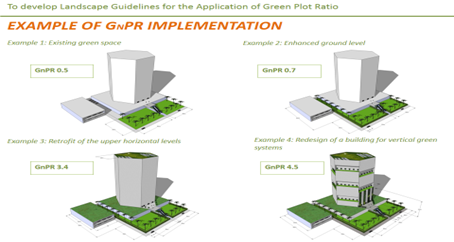
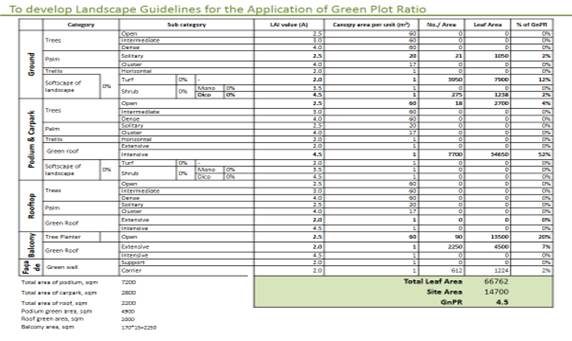
GnPR is defined as the ‘average leaf are index (LAI) of the greenery of a site”, an ecological measure that assigns values to particular plants based on the surface area of greenery (Ong, 2003). NParks defines GnPR as ‘the area weighted average leaf area index of a site’:
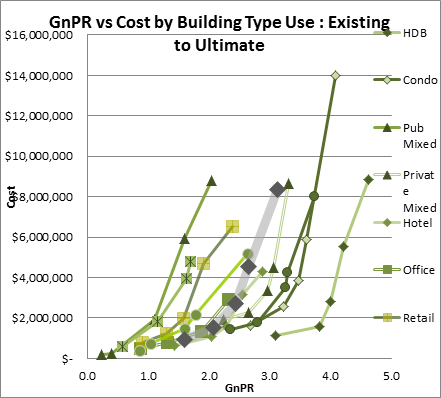
LAI values for different types of plants are found in a Guidebook on its use in the Calculation of Green Plot Ratio ‘Leaf Area Index of Tropical Plants’ (NParks, 2009). The RP’s methodology aims to determine achievable GnPR values that can be incorporated in a building type through a series of design simulations and statistical analysis of the data derived from these simulations. Figure 5 shows the hyperbolic slow-to-sharp rising trend of GnPR with the assigned Total Cost (S$) from the Existing to the Ultimate scenarios. Average increase of the GnPR level from the Existing to the Ultimate scenario is observed as follows:
- Residential – by 1.5 with the total cost increase of $10 million;
- Mixed (Residential-Commercial) – by 1.3 with the total cost increase of $7.4million;
- Commercial – by 1.7 with the total cost increase of $4.9 million;
- Factory – by 1.5 with the total cost increase of $8.9 million;
- Business Park – by 1.3 with the total cost increase of $6.6 million.
Average increase of the GnPR level from the Maximum to the Ultimate scenarios is observed as follows:
- Residential – by 0.5 with the total cost increase of $5.9 million;
- Mixed (Residential-Commercial) – by 0.3 with the total cost increase of $3.7 million;
- Commercial – by 0.6 with the total cost increase of $2.0 million;
- Factory – by 0.4 with the total cost increase of $4.8 million;
- Business Park – by 0.4 with the total cost increase of 3.9 million.
GnPR of 3.1 is achievable with the Total Cost of S$8.4 million for the Ultimate scenario while GnPR of 2.6 with the total cost of $4.6 million is achievable for the Maximum scenario.

Figure 5. GNPR vs Total CostEmpirical data for the Marginal Cost (MC) analysis model was obtained from the building audit of the 100 buildings. The lowest Marginal Cost is found to be at the GnPR levels for 5 land uses:
-
- Residential land use: existing condition (option) is 3.41 while the combined option is 3.67 with the total cost of $1,536,819
- Mixed (residential-commercial) land use: existing condition is 1.03 while the combined option is 2.71 with the total cost of $5,125,360
- Commercial land use: existing condition is 0.56 while the combined option is 2.13 with the total cost of $425,440
- Industrial land use – business parks: existing condition is 1.73 while the combined option is 1.97 with the total cost of $265,992
- Industrial land use – factories: existing condition is 0.25 while the combined options is 1.66 with the total cost of $14,274,033.
The GnPR optimisation adopts a heuristic algorithm that conforms to the usual practice of imposing constraints on a maximising objective function. Such an increasing function for GnPR is represented by incrementing the standard deviation from the mean GnPR (SD) within the boundary range of between +0.25SD and +2.0SD. In practice, for normally distributed GnPR, approximately 95 percent of the data points would fall within the spread of +1.96SD, i.e. +2.0SD from its mean. The 4-step rules of the GnPR heuristic optimisation model are devised as follows: the lowest and closest GnPR value for an incremented SD to the Ultimate GnPR is chosen as that particular highest boundary for the optimal GnPR level. Results of the heuristically modeled Optimal GnPR for 10 building types are summarised in Table 7. Finally, the Landscape Guidelines Report combines findings from the International Best Practices Review, Building Audit and Design Report, and Statistical Analysis. The guidelines provide the environmental, economical, aesthetic and social benefits of greenery for urban built-up areas. They examine the current landscape strategies, requirements, technologies and present GnPR as a tool for greenery measurement and the Optimal GnPR levels for various land use categories in Singapore.
| Land Use |
Building Type |
Optimal GnPR (design and economic) | |
|---|---|---|---|
| low | high | ||
|
Residential |
Public |
3.1 |
4.7 |
|
Private |
2.7 |
4.1 |
|
|
Mixed Residential-Commercial |
Public |
0.2 |
0.5 |
|
Private |
2.2 |
4.2 |
|
|
Commercial |
Hotel |
1.2 |
2.4 |
|
Office |
1.1 |
3.1 |
|
|
Retail |
0.9 |
2.6 |
|
|
Mixed |
0.8 |
2.6 |
|
|
Industrial |
Business Park |
2.3 |
3.7 |
|
Factory and Warehouse |
0.6 |
1.4 |
|
Table 7 Optimal GNPR


