The Impact of MRT Lines on Urban Mobility
Dr Dai Fangzhou uses the opening of the Mass Rapid Transit’s Circle Line in Singapore as a quasi-experiment to assess how individuals change their travel behaviour in response to improved access to rail transit, based on two household travel surveys.

Dr Dai Fangzhou is a Research Fellow at NUS Cities and has a PhD in Transportation Policy from NUS.
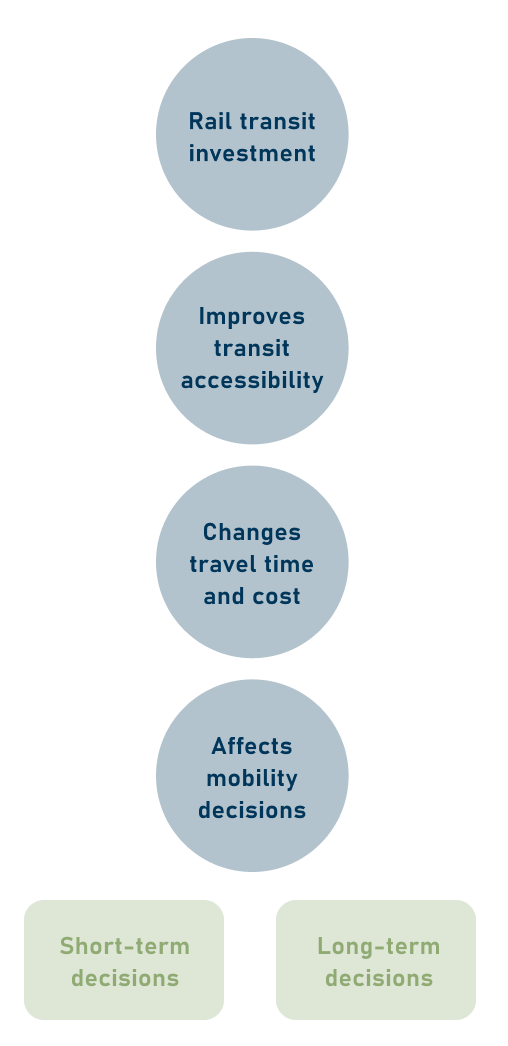
The rationale for this research relies on the established theory of random utility maximisation (RUM), introduced by American econometrician Daniel McFadden in 1974. McFadden’s key idea is that investment in rail transit changes travel time and costs, and enhances the rail transit system by improving accessibility from residential areas to transit stations, which further affects urban mobilities (Figure 1).
This study at NUS Cities focuses on two aspects of short-term urban mobility, also known as travel behaviour, which refer to travel mode choice and vehicle kilometers travelled (VKT).
Methodological Review
1. Case-control approach
The first group of studies adopts the case-control approach, which uses the spatial heterogeneity embedded in cross-sectional data to identify the effect of rail transit, by comparing individuals in a treatment zone with those in a control zone [1]. These studies provide useful insights into the association between rail transit infrastructure and travel mobility decisions. However, without the time dimension, it is challenging to identify causal inference or address potential endogeneity concerns.
2. Longitudinal approach
The second group of research studies adopts the longitudinal approach using panel data. Longitudinal studies assess the treatment effect of a policy intervention by tracing the behavioural changes of the same sample sets before, and after, the intervention in a more robust way [2][3]. Panel data, however, are usually difficult to acquire in transport research, due to the extensive time and resources needed for data collection.
3. Before-and-after approach
To address the methodological limitations of the case-control approach and the scarcity of panel data for longitudinal studies, the third group of studies conduct before-and-after studies using repeated cross-sectional data [4][5]. However, they cannot fully address the heterogeneity issues, which are potential sources of bias in estimating the treatment effect of new transit infrastructure.
Spatially, part of the observed differences in travel behaviour are not necessarily due to better transit services in the treatment zone, but rather, to the heterogeneity among residents. Temporarily, transit infrastructure can lead to residential relocation, and change the demographic composition of nearby neighbourhoods, confounding the accessibility improvement brought by rail transit.
Empirical Findings
Many researchers have found that living close to rail transit encourages a modal shift from private cars to public transport and less car use [6][7][8]. However, some researchers argue that the higher transit use and less driving in areas proximate to rail transit stations could be attributed, at least partially, to factors other than transit infrastructure per se, such as the built environment and residential self-selection [9][10].
Both the methodological drawbacks and the conflicting empirical findings provide motivations for this research. In addition, Singapore has its unique characteristics in terms of land and transport planning. Thus, investigating the impact of rail transit on individual or household travel mobility decisions, given the context of Singapore, is fundamental for decision-makers to design corresponding policies in order to address transport challenges, reduce car
dependency, and achieve more sustainable urban transport.
Methodology
Case Study
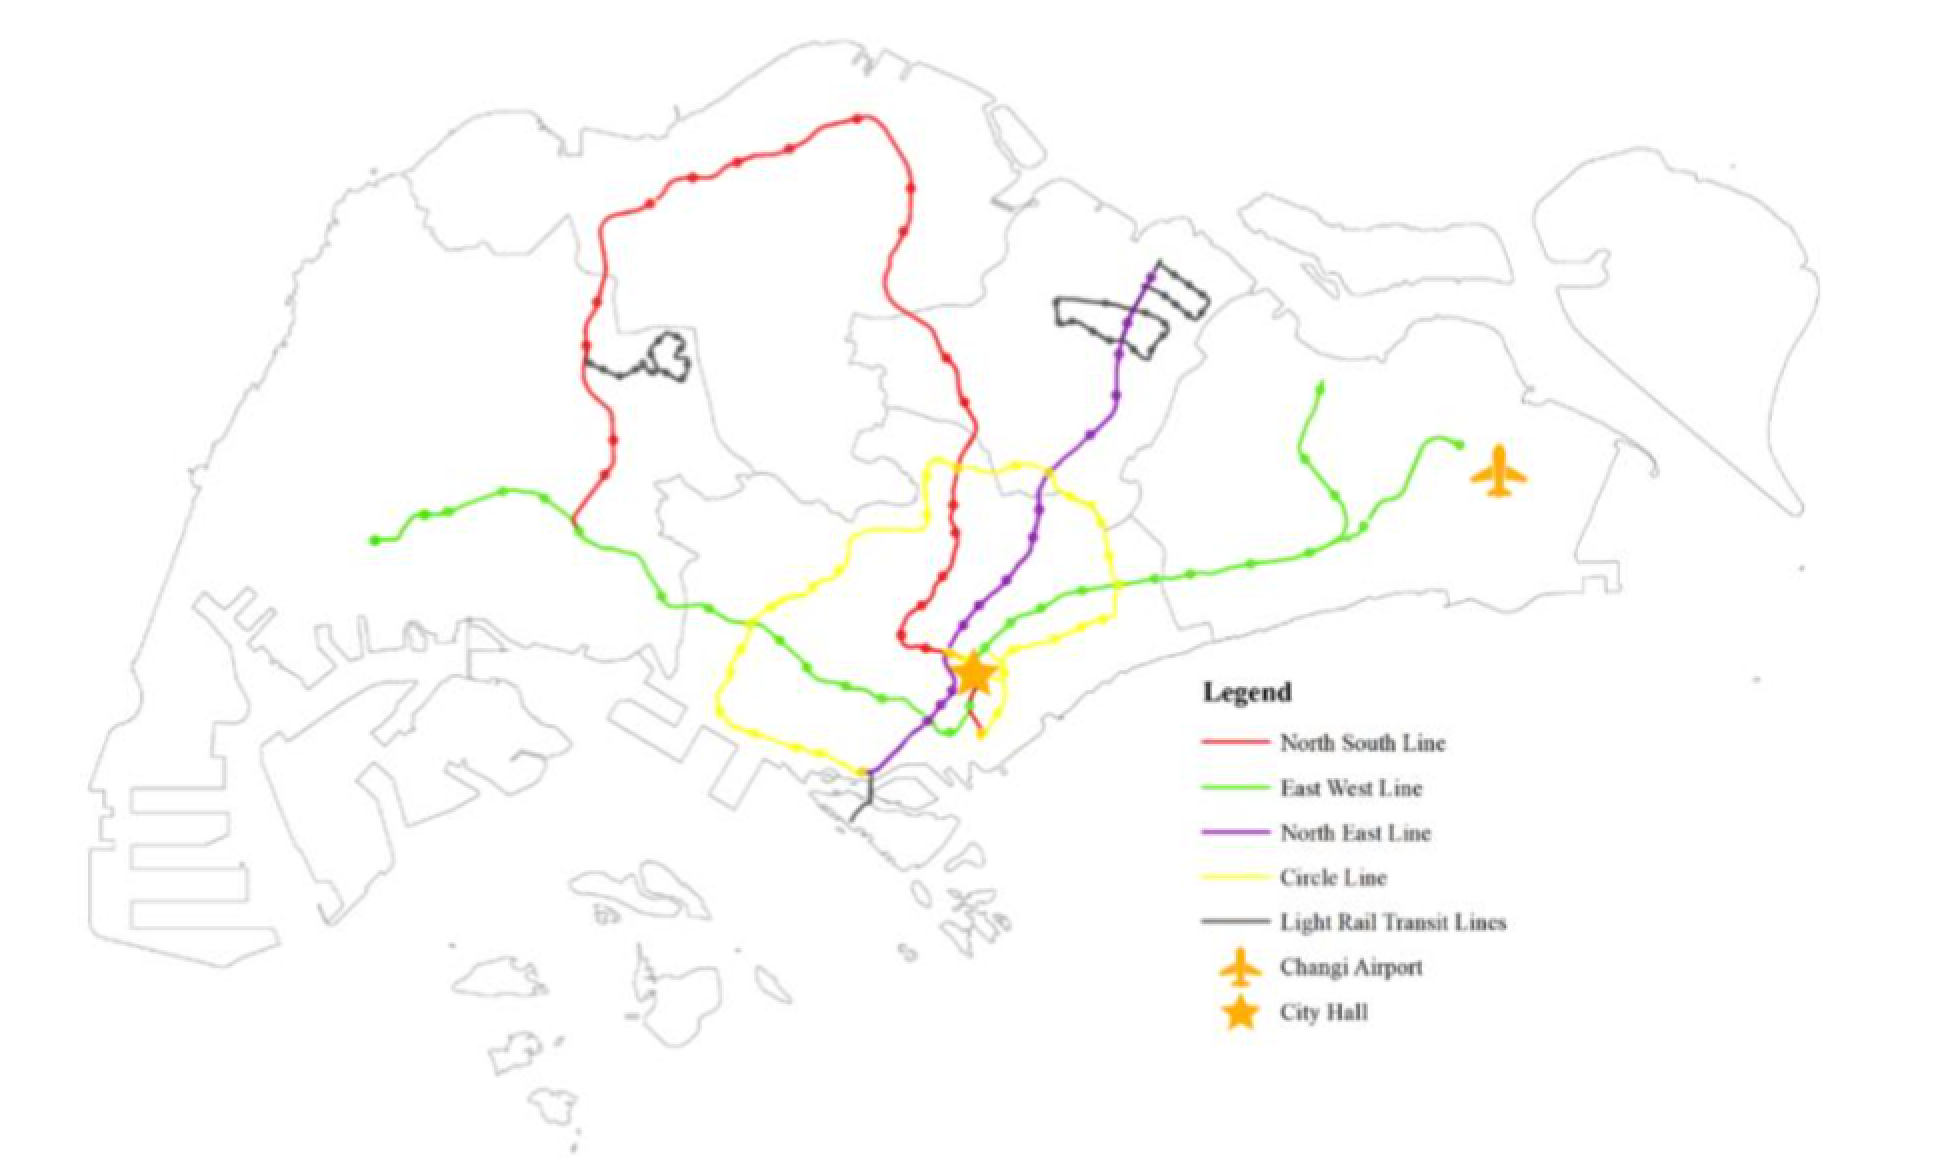
The Circle Line (CCL) is the fourth urban rail line on the Mass Rapid Transit (MRT) system in Singapore, and was opened in stages from 2009 to 2011, spanning 35.7 km across 30 stations, including six interchange stations. It was designed to have an orbital circular route, connecting all the radial MRT lines (the North South, East West, and North East lines) leading to the city centre (Figure 2).
Datasets
The main datasets used in this study are the 2008 and 2012 Household Interview Travel Surveys (HITS). HITS is conducted by the Land Transport Authority (LTA) every four to five years. The principal information includes postcodes, household sizes, income levels, age groups, the origin and destination of each trip, mode choices, and other demographic and travel categories.
Methods
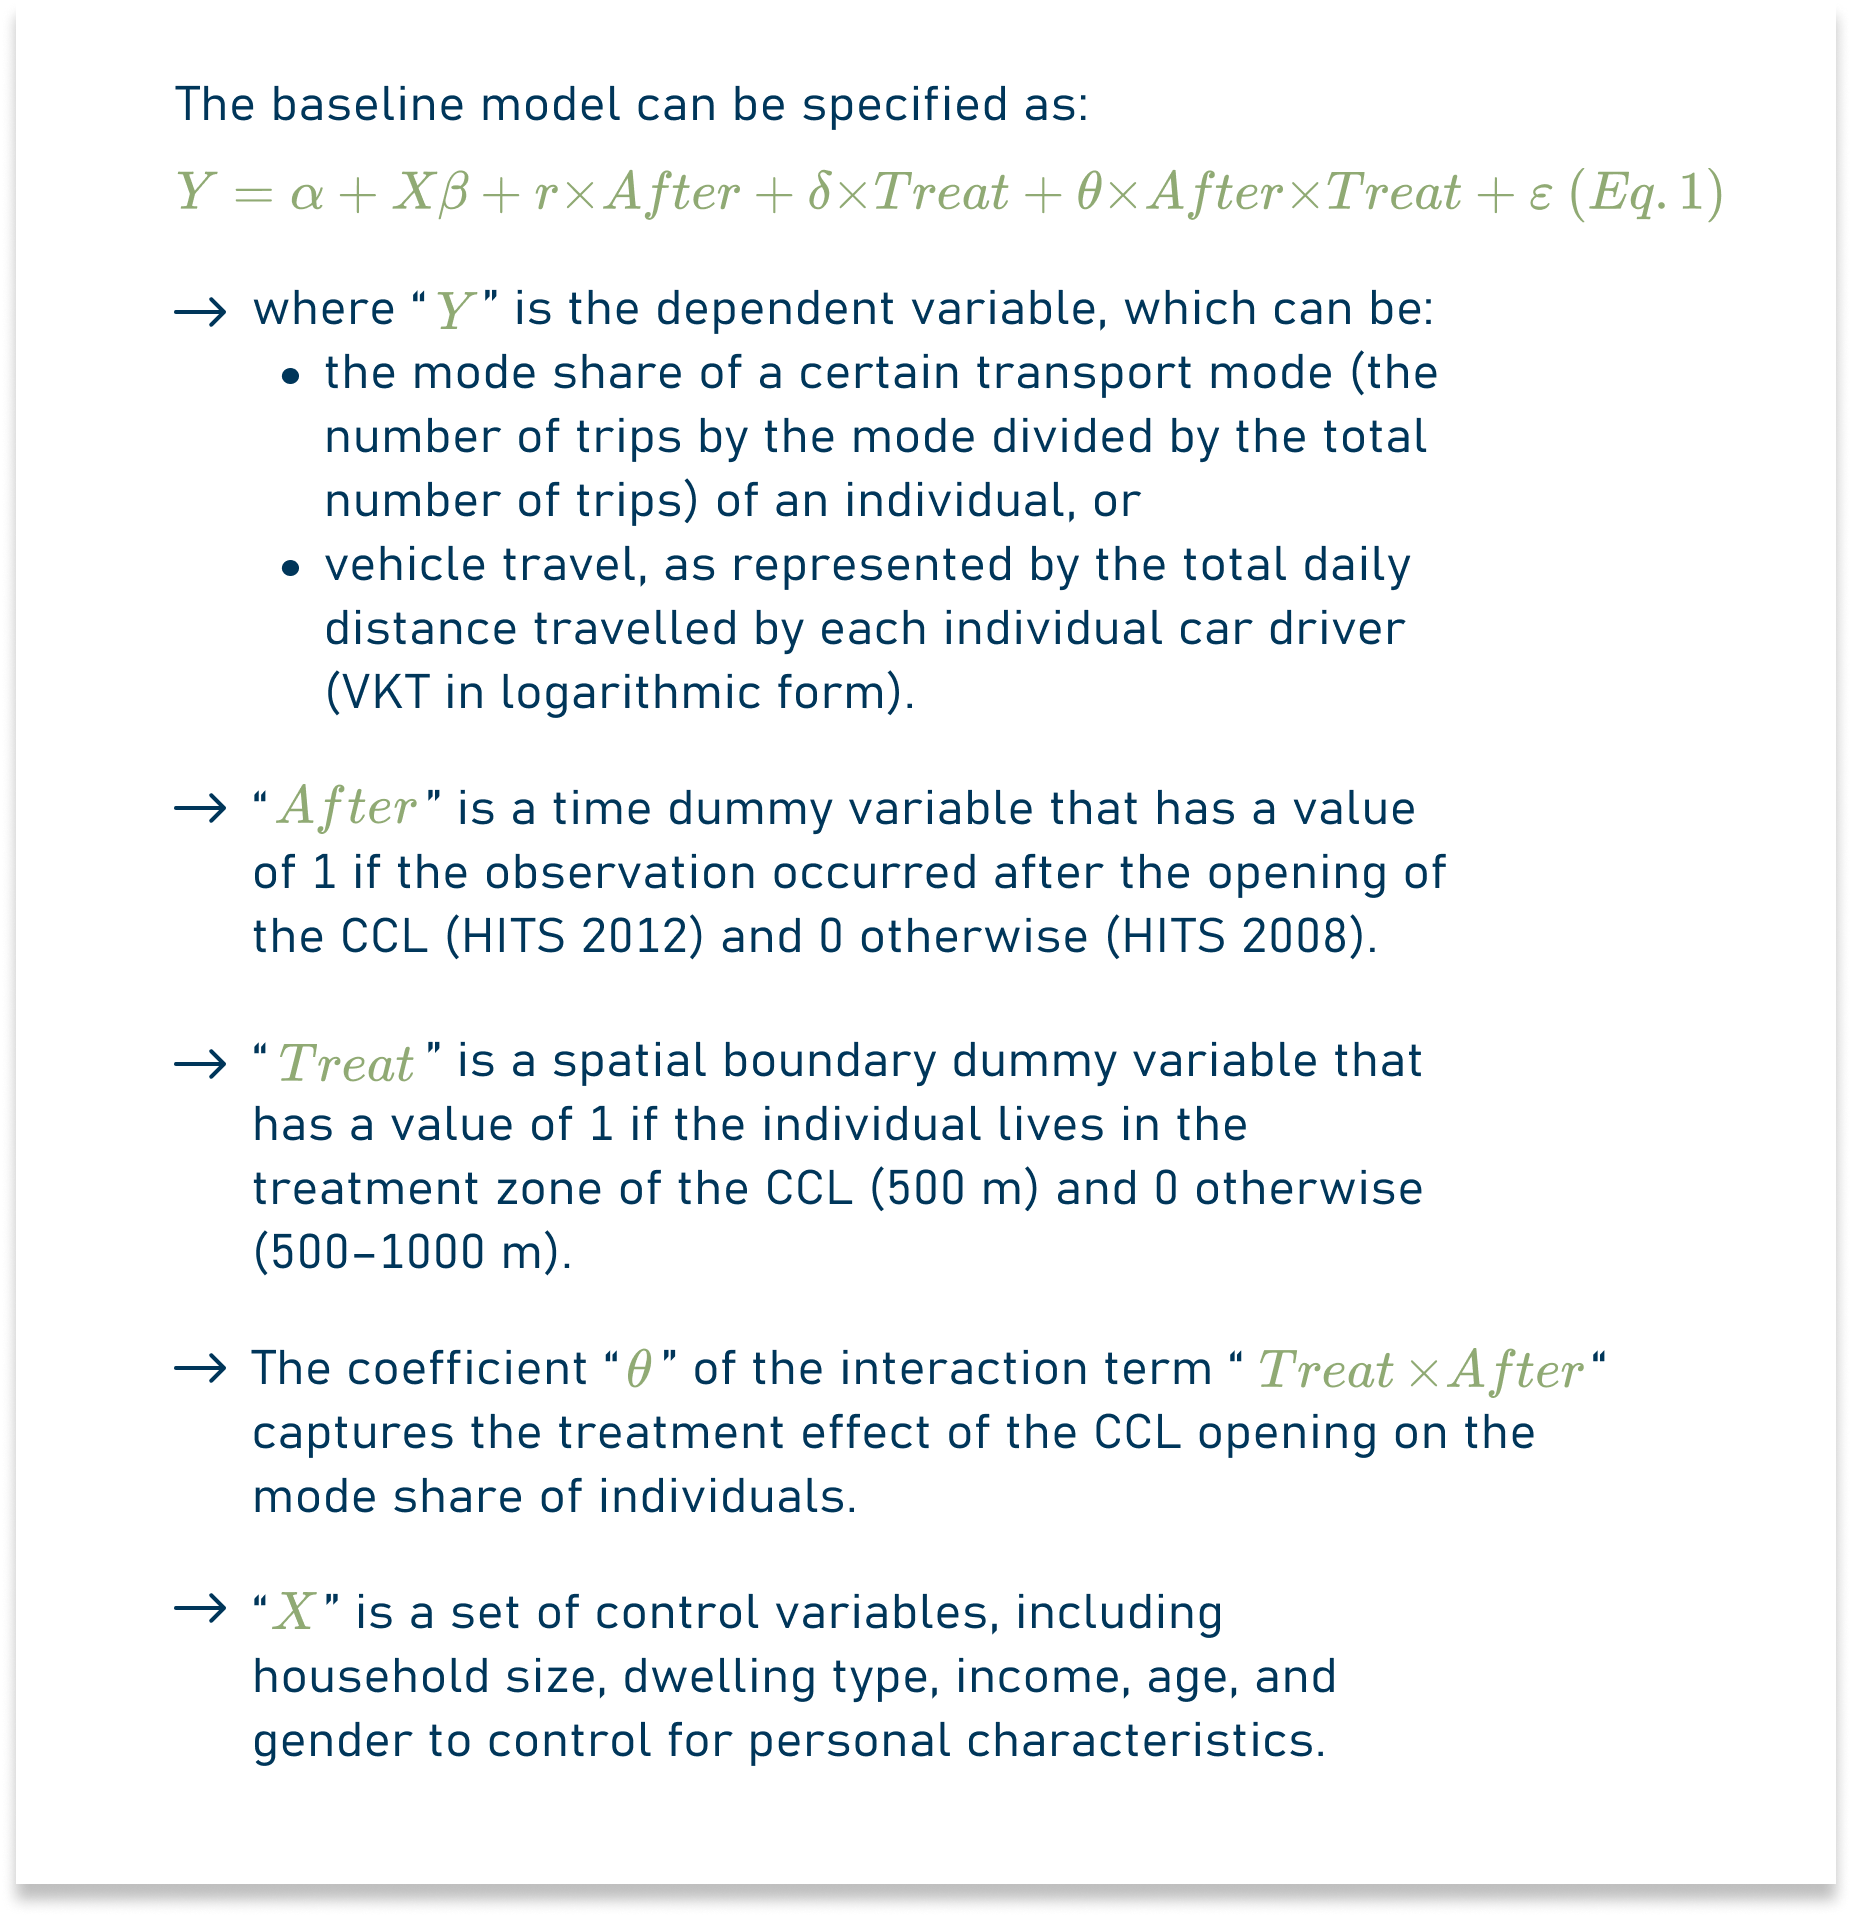
The Difference-in-difference (DID) method is the main one employed in this study, which is widely used by researchers to estimate the treatment effect of exogenous interventions by comparing the behavioural changes of a treatment group and a control group (differences in treatment and control zones) in response to a policy intervention (differences in before and after groups).
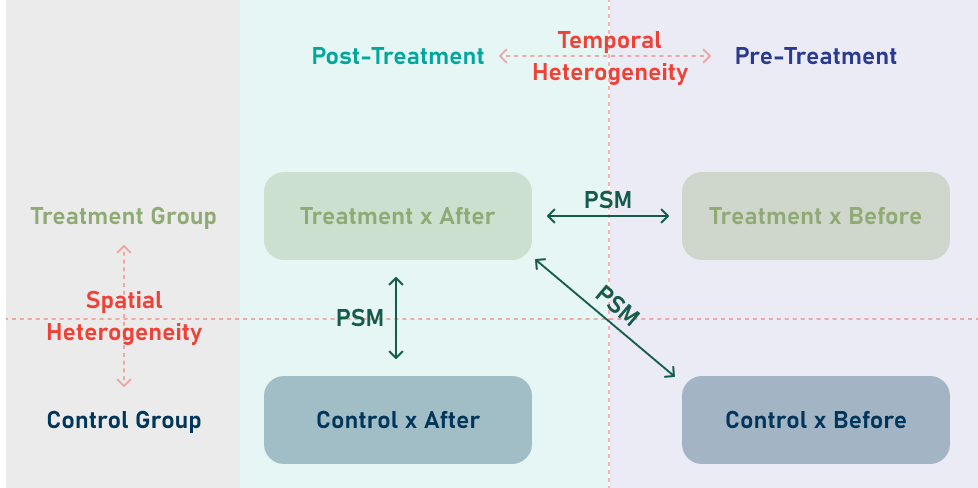
To control for heterogeneity among samples, a two-dimensional propensity score matching (PSM) approach is developed, classifying the observations into four subgroups and combining the three matched datasets into one (Figure 3). At this stage, it is possible to use the combined dataset to run regressions with matched samples that have similar socio-demographic characteristics among spatial and temporal dimensions.
Main Findings
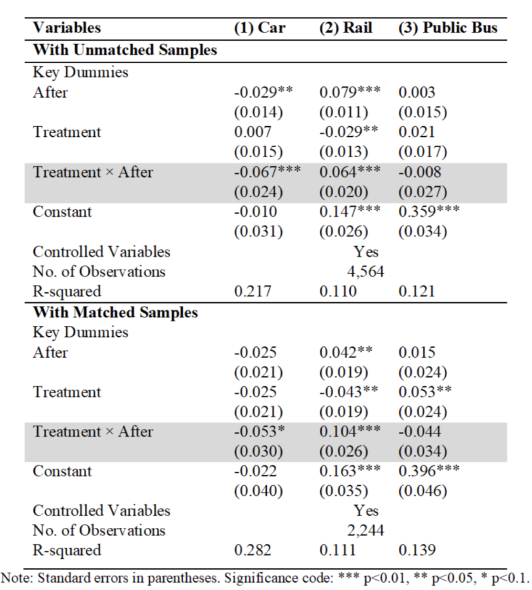
With unmatched samples, compared with those living in the 500–1,000 m buffer of CCL stations, the rail mode share of individuals living within 500 m of the stations increases and the car mode share decreases (Table 1). It is worth noting that the overall impact of the CCL on the mode share of public bus is insignificant, suggesting that the increase in rail transit trips comes mainly from previous car users rather than at the expense of bus ridership.
Focusing the matched samples, the results of the key dummies show that, if individuals were randomly assigned into the treatment and control zones, and did not move after the opening of the CCL, the car-to-rail mode switching effect of the CCL would still hold. Specifically, the cooling effect of the CCL on car mode share becomes weaker (from 6.7 percentage points to 5.3 percentage points), while the treatment effect on increasing MRT use becomes stronger (from 6.4 percentage points to 10.4 percentage points).
These results indicate that both travel-based residential self-selection and transit-induced gentrification may exist. In other words, the CCL attracts both households with a preference for public transit, as well as high-income households that own and use cars, to move into the station corridors.
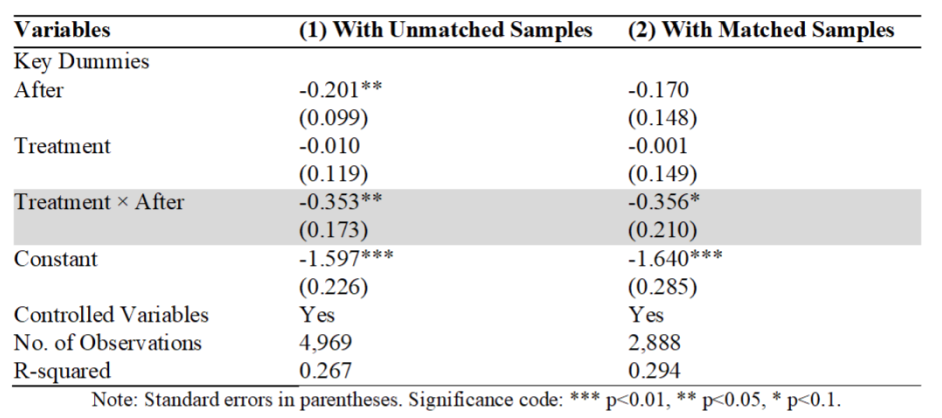
From Table 2, it can be seen that the CCL reduces car driving by 35.6% in the treatment area compared to the control area based on matched samples, increased by 0.3 percentage points from the result with unmatched samples.
In addition, the CCL effect estimated with matched samples becomes less significant, for its significance level changes from 0.05 to 0.1, possibly due to the decline in the number of persons in the control groups. With a two-stage regression on VKT, the opening of the CCL has a significant impact on individuals’ decision to drive in the first-stage regression model, but no significant effect on driving distance can be identified in the second stage.
In terms of socio-economic and demographic characteristics, individuals with a larger household size, living in more expensive dwelling types (landed properties, condos and private flats), and having higher salaries, as well as male travellers, are more likely to use cars with longer driving distances, and are less likely to use public transit than individuals with the opposite characteristics.
The treatment effect of the CCL also withstands a series of robustness checks, including running regression models with diverse boundary cuts of the treatment and control zones, and using sub-samples to check the heterogeneity of the treatment effect, as well as conducting the parallel trends tests.
Policy Implementation
On one hand, the LTA should continue investing in rail transit and building a sustainable public transportation system, as the results suggest that the CCL plays a vital role in encouraging public transit use and restricting car usage.
On the other hand, in order to promote rail transit use and achieve better resource allocation, it is important for the LTA to strike a balance between the affordability of public transit and the burden on taxpayers due to high operating and maintenance costs.
Additionally, when designing the next MRT line or new stations, the LTA should attach importance to individual or household characteristics and propose various policies to target different types of residents.
References
[1] Lund, H. M., Cervero, R., and Willson, R. W. (2006). A re-evaluation of travel behavior in California's TODs. Journal of Architectural and Planning Research, 23, 247–263.
[2] Handy, S., Cao, X., & Mokhtarian, P. (2005). Correlation or causality between the built environment and travel behavior? Evidence from Northern California. Transportation Research Part D: Transport and Environment, 10(6), 427–444.
[3] Mokhtarian, P. L., and Cao, X. (2008). Examining the impacts of residential self-selection on travel behavior: A focus on methodologies. Transportation Research Part B: Methodological, 42(3), 204–228.
[4] Habib, K. M. N., Swait, J., and Salem, S. (2014). Using repeated cross-sectional travel surveys to enhance forecasting robustness: Accounting for changing mode preferences. Transportation Research Part A: Policy and Practice, 67, 110–126.
[5] Zhu, Y., and Diao, M. (2016). The impacts of urban mass rapid transit lines on the density and mobility of high-income households: A case study of Singapore. Transport Policy, 51, 70–80.
[6] Bailey, L., Mokhtarian, P. L., and Little, A. (2008). The broader connection between public transportation, energy conservation and greenhouse gas reduction. Fairfax, VA: ICF International.
[7] Salon, D. (2009). Neighborhoods, cars, and commuting in New York City: A discrete choice approach. Transportation Research Part A: Policy and Practice, 43, 180–196.
[8] Shen, Q., Chen, P., and Pan, H. (2016). Factors affecting car ownership and mode choice in rail transit-supported suburbs of a large Chinese city. Transportation Research Part A: Policy and Practice, 94, 31–44.
[9] Cao, X. (2019). Examining the effect of the Hiawatha LRT on auto use in the Twin Cities. Transport Policy, 81, 284–292.
[10] Chatman, D. G. (2013). Does TOD need the T? Journal of the American Planning Association, 79(1), 17–31.
[11] Dai, F., Diao, M., and Sing, T. F. (2022). A two-dimensional propensity score matching approach to estimating the treatment effect of urban rail transit lines on vehicle travel. Transportation, https://doi.org/10.1007/s11116-022-10360-2.
[12] Dai, F., Diao, M., and Sing, T. F. (2020). Effects of rail transit on individual travel mode shares: A two-dimensional propensity score matching approach. Transportation Research Part D: Transport and Environment 89, Article 102601.
[13] Habib, K. M. N., and Wong, B. (2015). Effects of accessibility to the transit stations on intercity travel mode choices in contexts of high-speed rail in the Windsor-Quebec corridor in Canada. Canadian Journal of Civil Engineering, 42(11), 930–939.
[14] Handy, S. (2006). Longer view: The road less driven. Journal of the American Planning Association, 72, 274–278.
[15] McFadden, D. (1974). The measurement of urban travel demand. Journal of Public Economics, 3(4), 303–328.

