

Using Analytic Hierarchy Process (AHP) to Conduct A Safety Risk Analysis
By Chia Ji Ji1 and Hu Xinping2 | 11 Aug 2020
1Formerly Honours Student, Department of Building, School of Design and Environment, National University of Singapore.
2Research Assistant, Safety and Resilience Research Unit (SaRRU), Department of Building, School of Design and Environment, National University of Singapore. E-mail: xinping@nus.edu.sg
Analytic Hierarchy Process
Analytic Hierarchy Process (AHP) is a mathematical theory for organising and analysing complex decisions. This decision-making tool has been used in assessing construction safety systems and hazards in studies, where respondents are from various backgrounds. AHP quantitatively evaluates the criteria and activities to provide a comprehensive risk index for decision-makers.
Case Study on Perceived Operational Risk
A case study is conducted using the data collected from a high-rise modular construction site in Singapore. The risks involved in different construction processes are not necessarily equal. Therefore, it is important to develop fair risk assessment indexes. AHP helps with the process by collecting the relative risk index and deriving a comprehensive risk assessment index.
Step 1: Data Collection
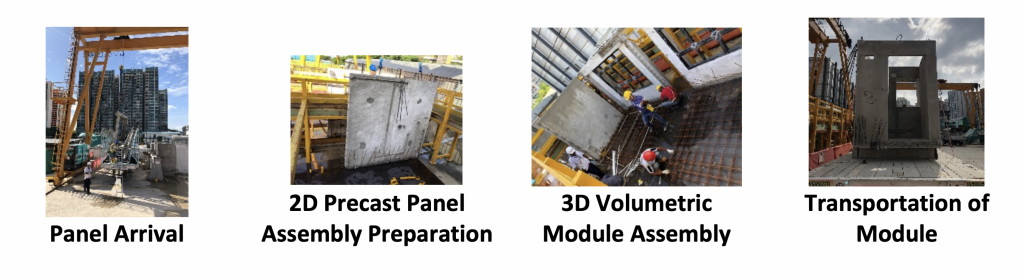
In a precast construction site, safety risks exist in many phases such as the arrival of panels, the assembly of panels, the assembly of modules, and the transportation of modules.
The first step in an AHP is to obtain the pair-wise index, a comparison of activities based on each possible pair. This case study uses a questionnaire to obtain such index from respondents on the site. The results of the questionnaires are listed in Table 1. The shaded cells are reciprocal values.
The perceived risk ratings represent the respondents’ attitudes towards the relative risk involved in two phases. For example, Panel Assembly and Module Assembly are half as hazardous as Panel Arrival; Module Transportation is twice as hazardous as Panel Arrival. Respondents think Panel Assembly has the same risk as Module Assembly and Module Transportation, and Module Assembly has the same risk as Module Transportation.
Table 1. Perceived risk ratings of project phases
| Panel Arrival | Panel Assembly | Module Assembly | Module Transportation | |
| Panel Arrival | 1 | 2 (= 1/0.5) | 2 (= 1/0.5) | 0.5(= 1/2) |
| Panel Assembly | 0.5 | 1 | 1 (= 1/1) | 1 (= 1/1) |
| Module Assembly | 0.5 | 1 | 1 | 1 (= 1/1) |
| Module Transportation | 2 | 1 | 1 | 1 |
| Total | 4 | 5 | 5 | 3.5 |
The raw data has to be processed to ensure consistency.
Step 2: Normalisation
The next step is to normalise the data to ensure that the numerical input data is matched and analysed under a common scale. In Table 2 provided, values are normalised to the value of 1.
Table 2. Normalised data
| Panel Arrival | Panel Assembly | Module Assembly | Module Transportation | |
| Panel Arrival | 0.25 (= 1/4) | 0.4 | 0.4 | 0.14 |
| Panel Assembly | 0.125 | 0.2 | 0.2 | 0.29 |
| Module Assembly | 0.125 | 0.2 | 0.2 | 0.29 |
| Module Transportation | 0.5 | 0.2 | 0.2 | 0.29 |
| Common scale | 1 | 1 | 1 | 1 |
Step 3: Eigenvalue
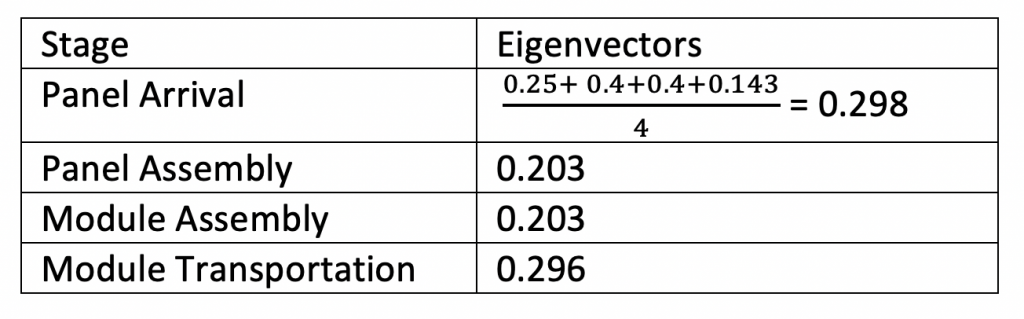
To determine the activity with the highest risk, calculations are made using the Eigenvalue which shows the local weights of each activity. This is derived by taking the sum of normalised valued divided by the number of factors as seen in Table 3.
Table 4. Eigenvector calculation
Step 4: Consistency Test
To check for reliability of data set, a consistency test should be conducted. In the case that Activity 1 is moderately more important than Activity 2, and Activity 2 is moderately more important than Activity 3, then Activity 3 should be significantly more important than Activity 1. Consistency Ratio of less than 10% is considered acceptable.
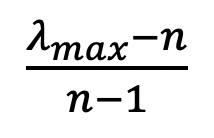
The consistency index is based on maximum Eigenvalue, which can be calculated by taking the sum of the product of each element in the Eigenvector to the total comparison matrix. The consistency Index can be derived with the following formula:
In application to the case,
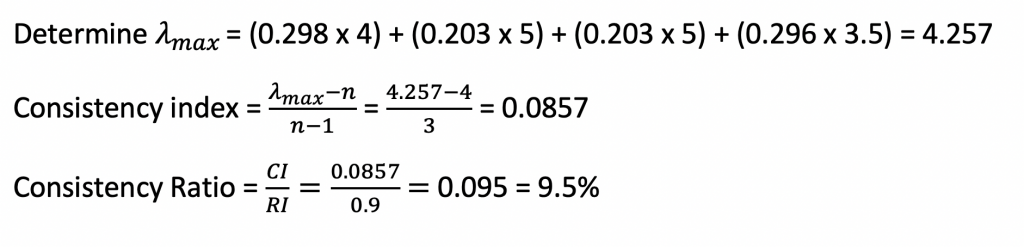
Since CR = 9.5% <10%, the data is consistent and can be used.
The calculation is applied to all criteria and activity responses and only consistent data should be extracted.
Step 5: Global Ranking
The last step is to combine the local weightage to provide a global perspective of the risk distribution across all perspectives. The global weight of the activity is the product of the local weight of phases and the respective activities (Table 4). The global weight of each activity represents the perceived risk involved in such activity.
The highlighted activities are the activities that are perceived to have the greatest risk. By comparing the global weightage of different activities in different phases, the riskier activities can be found and the results can be used in risk assessment. This analysis will provide project managers and safety supervisors some comprehensive insights into risk assessment on site.
For example, the activity of rigger/signalman entering panel storage area in the phase of panel arrival is riskier than the same activity in the phase of Panel Assembly.
Table 4. Global weightage of risk
| Phases | Local Criteria Weightage | Activities | Local Activity Weightage | Global Weightage |
| Panel arrival | 0.30 | Rigger/ Signalman enters panel storage area | 0.29 | 0.30 x 0.29 = 0.087 |
| Rigger/ Signalman hooks chain to panel | 0.29 | 0.09 | ||
| Rigger/ Signalman attach tagline to panel | 0.18 | 0.05 | ||
| Rigger/ Signalman exits lifting area | 0.25 | 0.07 | ||
| Panel Assembly | 0.20 | Rigger/ Signalman lifts panel | 0.25 | 0.05 |
| Rigger/ Signalman guides wall panel to designated location using GC and tagline | 0.29 | 0.06 | ||
| Rigger/ Signalman detaches tagline to panel | 0.17 | 0.03 | ||
| Wall lowered to floor and aligned with floor props | 0.14 | 0.03 | ||
| (top) Push Pull prop installation on panel | 0.14 | 0.03 | ||
| Module Assembly | 0.20 | Rebar jointing of vertical elements | 0.13 | 0.03 |
| Horizontal base slab rebar installation | 0.13 | 0.03 | ||
| Concealed piping services installation between slab reinforcement | 0.13 | 0.03 | ||
| Formwork installation | 0.13 | 0.03 | ||
| Casting and curing of concrete between vertical element joints | 0.25 | 0.05 | ||
| Grouting - upper floors | 0.25 | 0.05 | ||
| Module transportation | 0.30 | Rigger/ Signalman hooks chain to module | 0.36 | 0.11 |
| Rigger/ Signalman attach tagline to module | 0.11 | 0.03 | ||
| Rigger/ Signalman exits lifting area | 0.23 | 0.07 | ||
| Transported by trailer/ low bed trailer | 0.30 | 0.09 |
Application of the research
After completing a risk assessment, risk mitigation strategies will be required. AHP can also be used as a tool to find out the most effective risk mitigation strategies.
References
MINBAKHSH, S., GUNDUZ, M. & SONMEZ, R. 2013. Safety risk assessment using analytic hierarchy process (AHP) during planning and budgeting of construction projects. Journal of safety research, 46, 99-105.
DZIADOSZ, A. & REJMENT, M. 2015. Risk Analysis in Construction Project - Chosen Methods. Procedia Engineering, 122, 258-265.
GUNDUZ, M. & LAITINEN, H. 2018. Construction Safety Risk Assessment with Introduced Control Levels. Journal of Civil Engineering and Management, 24, 11-18.